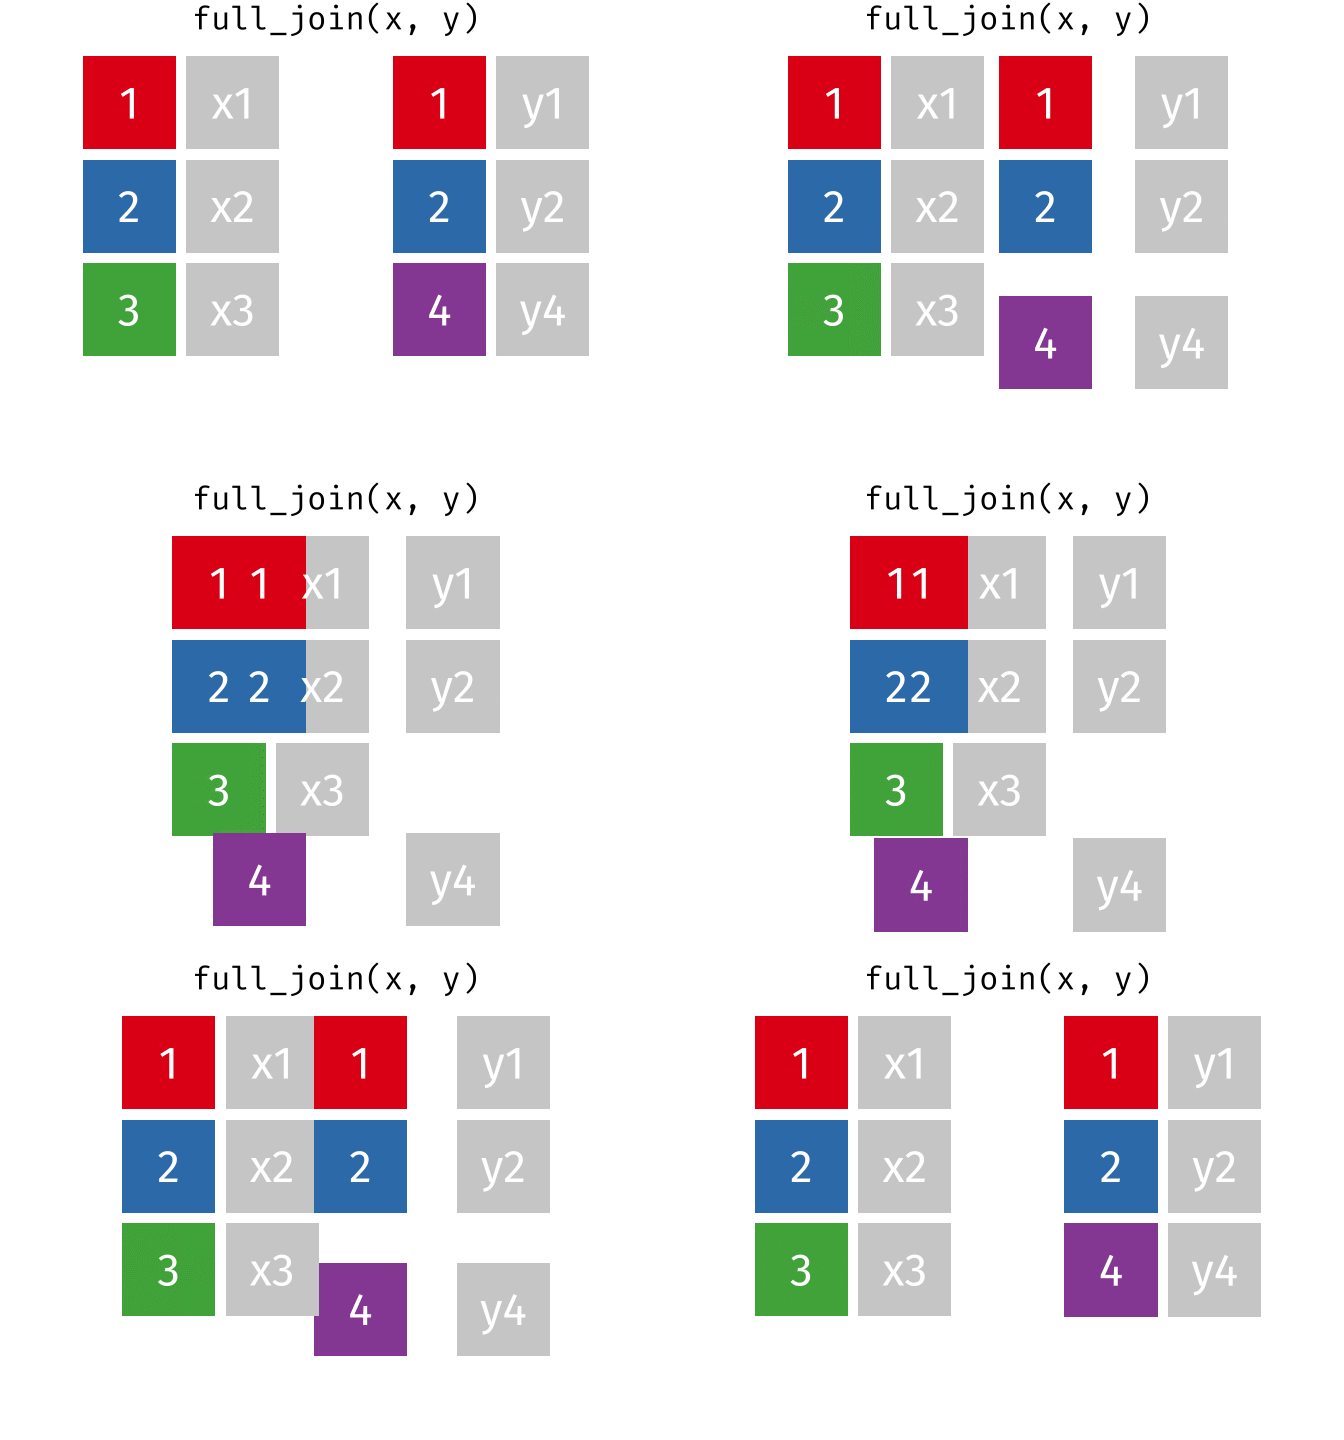
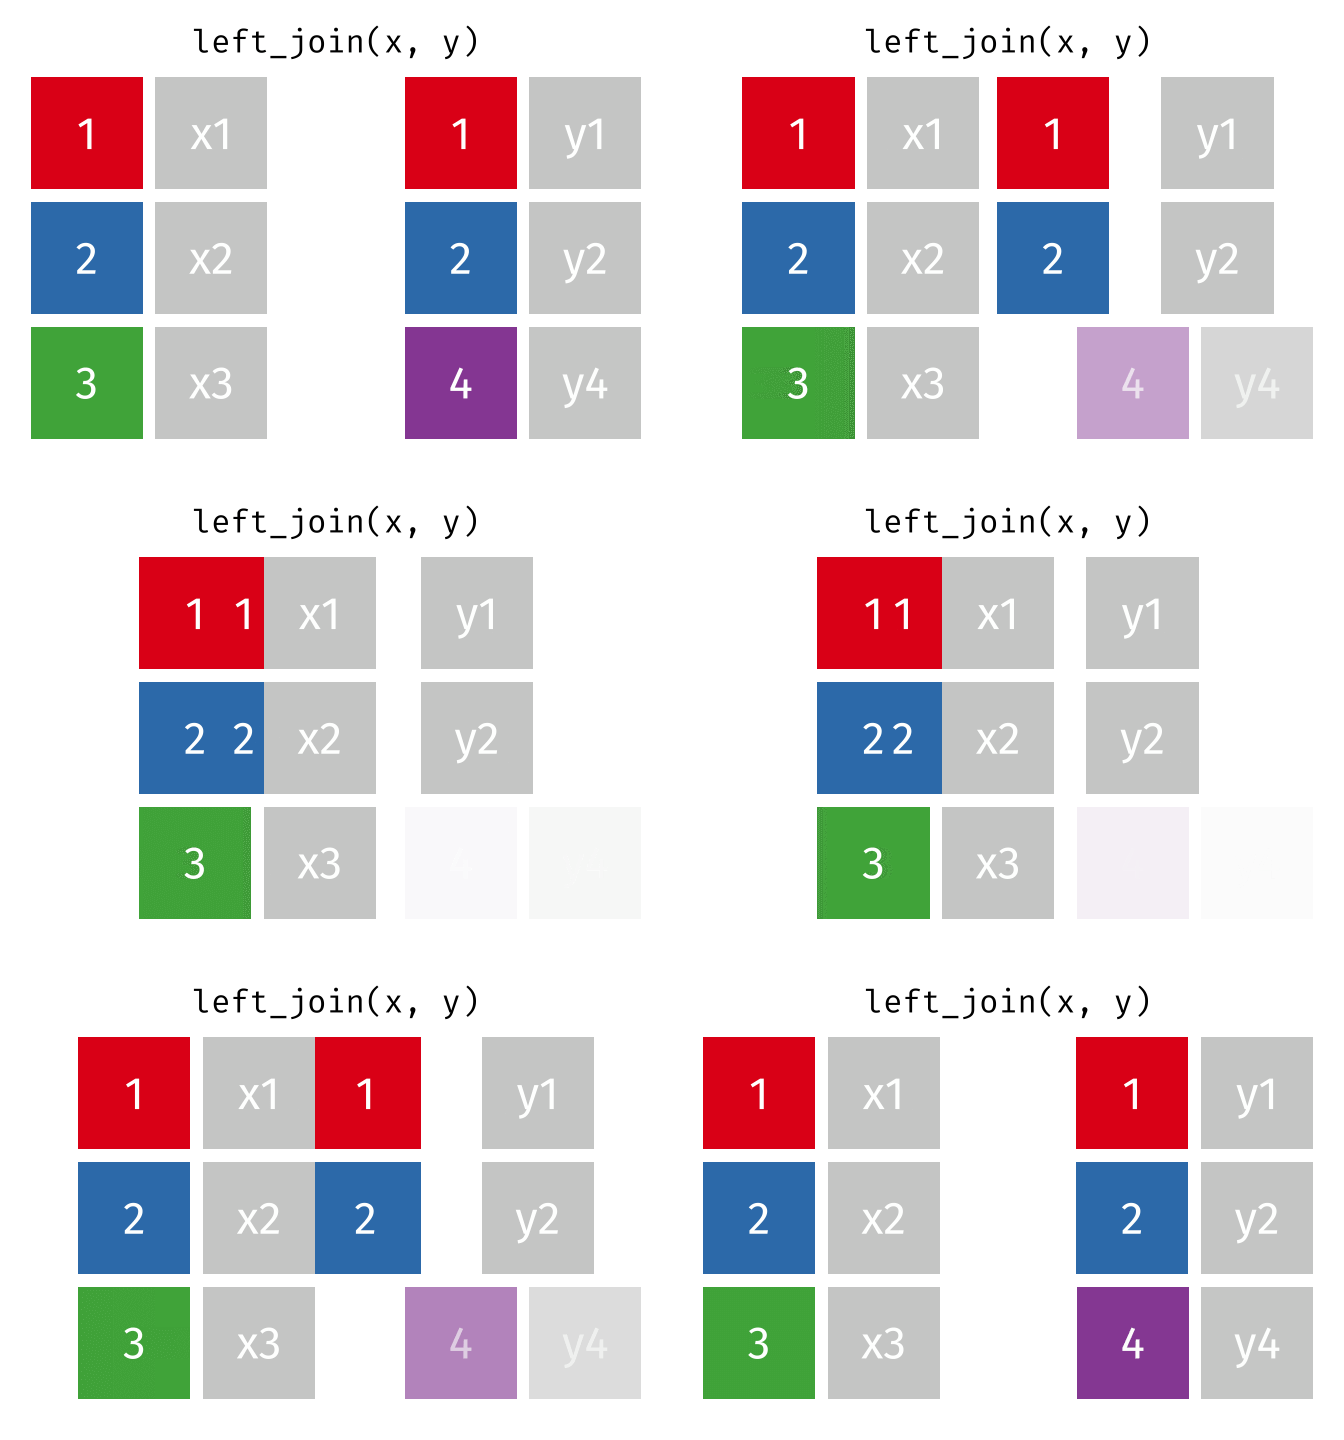
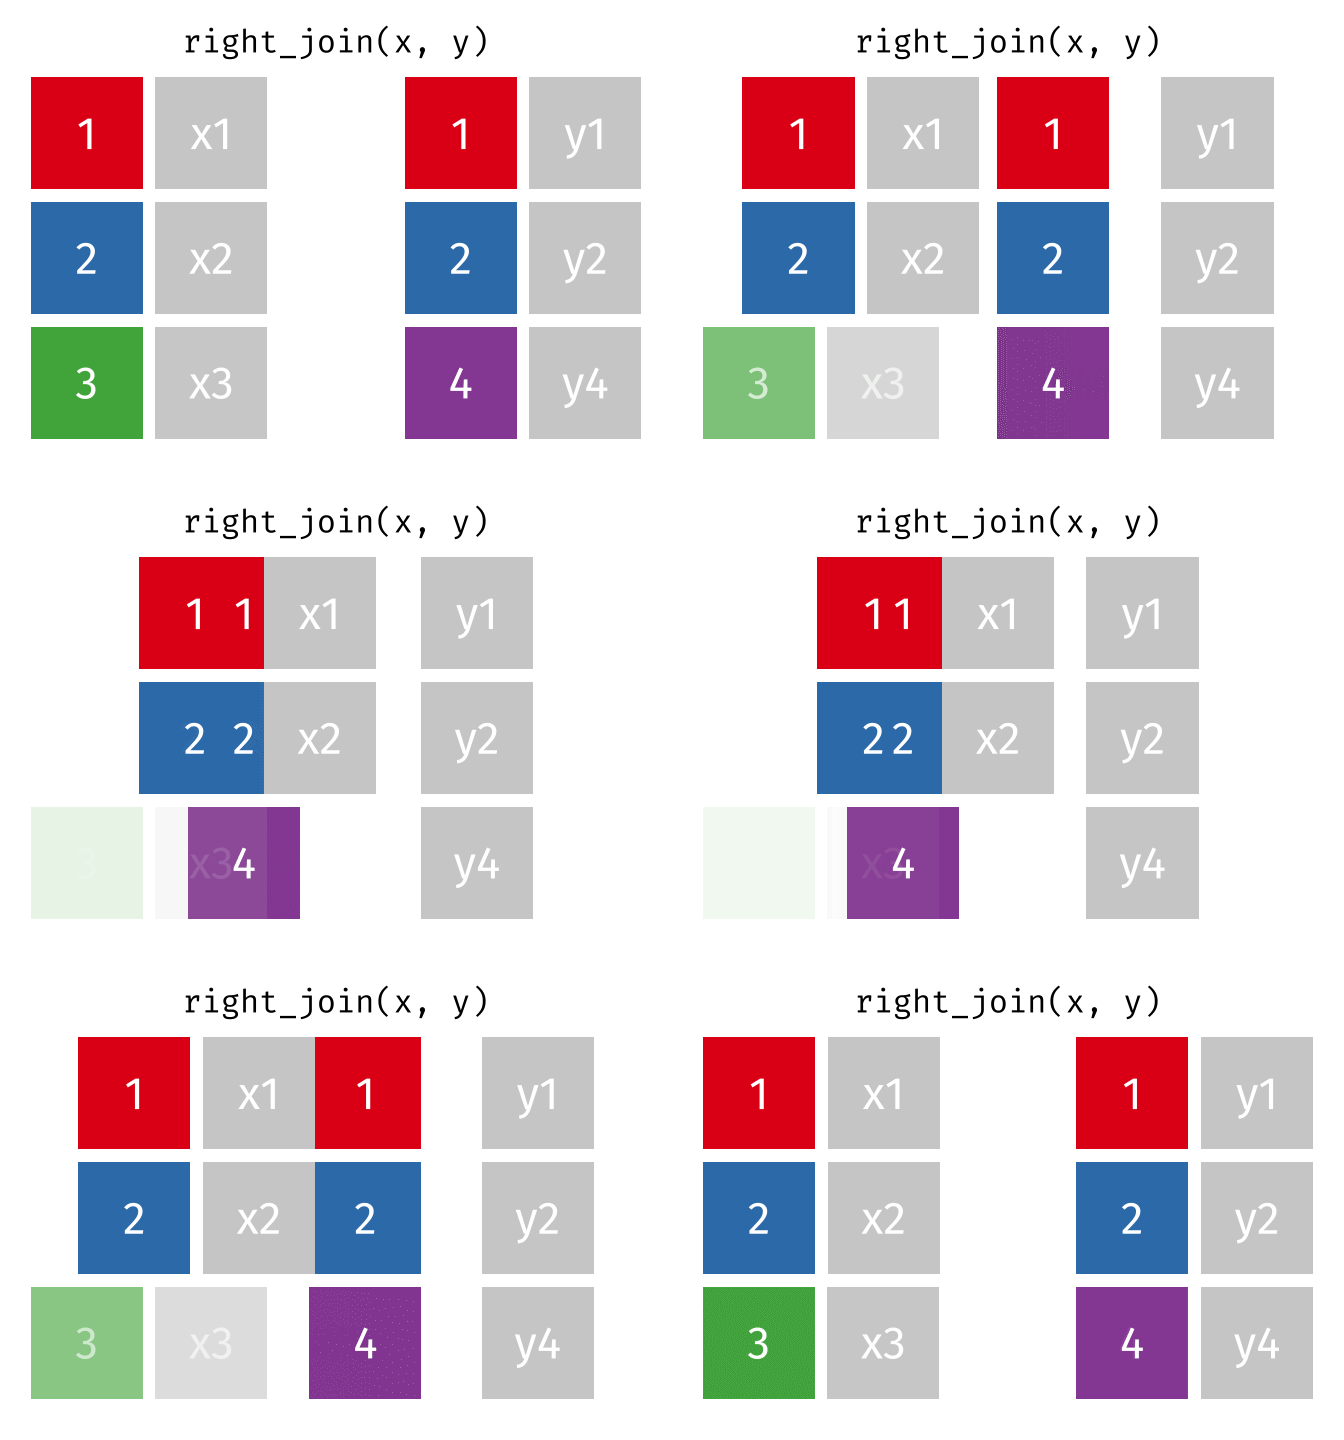
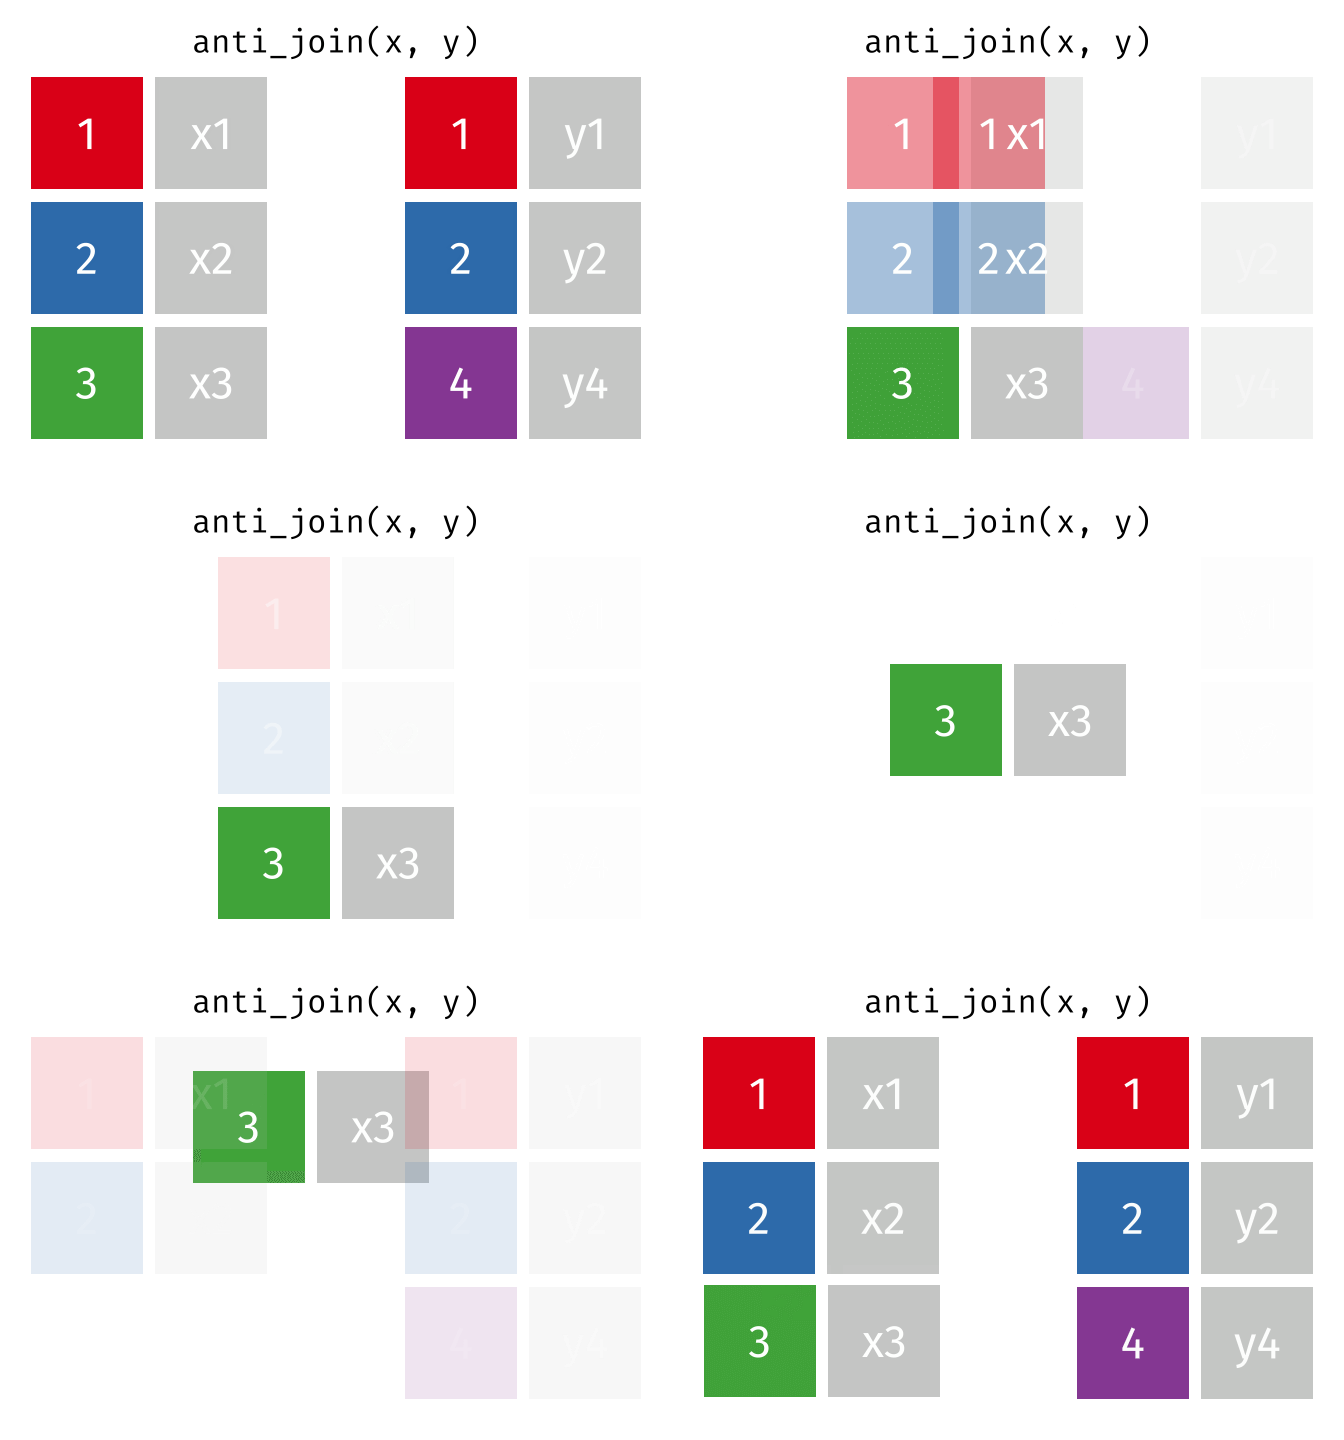
class: center, middle, inverse, title-slide # Manipulating and analysing data with dplyr ## Data analysis and visualization in R <br> UC Merced ### Andrea Sánchez-Tapia <br> Rio de Janeiro Botanical Garden - ¡liibre! - RLadies+ ### 2021-03-23 --- ## today + dplyr and the "tidyverse" -- + the pipe operator -- + tidy data, pivoting data, joining tables -- + group and summarize -- + data visualization with ggplot2 --- class: middle, center, inverse ## manipulating and analyzing data with dplyr --- background-image: url("https://d33wubrfki0l68.cloudfront.net/621a9c8c5d7b47c4b6d72e8f01f28d14310e8370/193fc/css/images/hex/dplyr.png") background-position: 98% 2% background-size: 150px ## the tidyverse: an "umbrella" package -- + __ggplot2__: a "grammar of graphics" by Hadley Wickham. Divide the data and the <br> aesthetics. Create and modify the plots layer by layer -- + __dplyr__: a way to deal with data frames, sql external data bases, written in `C++` -- + __readr__: read data -- + __tidyr__: format data frames -- + __stringr__: deals with strings -- + __tibble__: a new data structure -- + other packages: __lubridate__ (dates), __forcats__ (factors), and many more -- Most of R is still __base__-based and both philosophies communicate well with each other --- ## reading data with __readr__ ```r library(dplyr) library(readr) ``` -- ```r surveys <- readr::read_csv("data/raw/portal_data_joined.csv") ``` ``` ## ## ── Column specification ──────────────────────────────────────────────────────── ## cols( ## record_id = col_double(), ## month = col_double(), ## day = col_double(), ## year = col_double(), ## plot_id = col_double(), ## species_id = col_character(), ## sex = col_character(), ## hindfoot_length = col_double(), ## weight = col_double(), ## genus = col_character(), ## species = col_character(), ## taxa = col_character(), ## plot_type = col_character() ## ) ``` --- ## the tibble ```r surveys vignette("tibble") #show what a vignette is ``` + modified data frames + do not change input type (characters into factors) + do not change the name of the columns and allows for non-standard names, such as `1999` and `total count` (it will require back ticks) + no rownames <!-- + do not recycle vectors of length over 1 --> <!-- + printing modified: ten rows, columns that fit, description of column type --> + subsetting always returns a tibble --- ## some principal functions in __dplyr__ + __select__ (columns) -- + __filter__ (rows) -- + __rename__ (columns) -- + __mutate__ (create new columns or modify existing columns) -- + __arrange__ to sort according to a column -- + __count__ cases of one or many columns --- ## select columns ```r select(surveys, plot_id, species_id, weight) ``` -- 1. there is no need to put quotes 2. there is no need to put variables between `c()` -- #### base R still works in a tibble ```r surveys[, c("plot_id", "species_id", "weight")] ``` --- ## removing columns ```r select(surveys, -record_id, -species_id) ``` --- ## additional functions ```r select(surveys, -ends_with("id")) ``` `starts_with`, `contains`, `all_of`, `last_col` --- ## filter rows __logical clauses!__ ```r surv_1995 <- filter(surveys, year == 1995) ``` #### No need to use $ or brackets ```r surveys$year == 1995 surveys[surveys$year == 1995 , ] ``` --- ## mutate creates or modifies columns ```r surveys <- mutate(surveys, weight_kg = weight / 1000) ``` ```r mutate(surveys, weight_kg = weight / 1000, weight_lb = weight_kg * 2.2) ``` --- ## `group_by()` and `summarise()` + if you have a column factor (e.g. sex) and want to apply a function to the levels of this factor ```r surveys_g <-group_by(surveys, sex) #does nothing? summary_sex <- summarize(surveys_g, mean_weight = mean(weight, na.rm = TRUE)) summary_sex ``` ``` ## # A tibble: 3 x 2 ## sex mean_weight ## <chr> <dbl> ## 1 F 42.2 ## 2 M 43.0 ## 3 <NA> 64.7 ``` --- ## another example: ```r surveys_g2 <-group_by(surveys, sex, species_id) mean_w <- summarize(surveys_g2, mean_weight = mean(weight, na.rm = TRUE)) ``` --- ```r mean_w ``` ``` ## # A tibble: 92 x 3 ## # Groups: sex [3] ## sex species_id mean_weight ## <chr> <chr> <dbl> ## 1 F BA 9.16 ## 2 F DM 41.6 ## 3 F DO 48.5 ## 4 F DS 118. ## 5 F NL 154. ## 6 F OL 31.1 ## 7 F OT 24.8 ## 8 F OX 21 ## 9 F PB 30.2 ## 10 F PE 22.8 ## # … with 82 more rows ``` --- ## arrange sorts by a column ```r arrange(mean_w, mean_weight) arrange(mean_w, desc(mean_weight)) ``` --- background-image: url("https://external-content.duckduckgo.com/iu/?u=https%3A%2F%2Ftse1.mm.bing.net%2Fth%3Fid%3DOIP.kBwKFkkvi_Ye6osZkQrjnwAAAA%26pid%3DApi&f=1") background-position: 98% 2% background-size: 150px ## the pipe operator `%>%` Classic syntax goes like this ```r object1 object2 <- function1(object1) object3 <- function2(object2) ``` -- ...or you can nest functions and avoid create intermediary objects ```r object3 <- function2(function1(object1)) ``` -- The pipe operator allows to apply functions sequentially: ```r object3 <- object1 %>% function1() %>% function2() ``` --- ## select and filter ```r surveys2 <- filter(surveys, weight < 5) surveys_sml <- select(surveys2, species_id, sex, weight) surveys %>% filter(weight < 5) %>% select(species_id, sex, weight) ``` + you can append `head()` or `View()` --- ## `group_by()` and `summarize()` ```r surveys_g <- group_by(surveys, sex) #does nothing? summary_sex <- summarize(surveys_g, mean_weight = mean(weight, na.rm = TRUE)) summary_sex <- surveys %>% group_by(sex) %>% summarize(mean_weight = mean(weight, na.rm = TRUE)) ``` --- ## count ```r surveys %>% count(sex) surveys %>% count(sex, species) surveys %>% count(sex, species) %>% arrange(species, desc(n)) ``` --- ## challenge + How many animals were caught in each `plot_type` surveyed? + Use `group_by()` and `summarize()` to find the mean, min, and max hindfoot length for each species (using `species_id`). Also add the number of observations (hint: see `?n`). -- --- ## save data! ```r surveys <- readr::read_csv("data/raw/portal_data_joined.csv") ``` ``` ## ## ── Column specification ──────────────────────────────────────────────────────── ## cols( ## record_id = col_double(), ## month = col_double(), ## day = col_double(), ## year = col_double(), ## plot_id = col_double(), ## species_id = col_character(), ## sex = col_character(), ## hindfoot_length = col_double(), ## weight = col_double(), ## genus = col_character(), ## species = col_character(), ## taxa = col_character(), ## plot_type = col_character() ## ) ``` ```r surveys_complete <- surveys %>% filter(!is.na(weight), !is.na(hindfoot_length), !is.na(sex)) species_counts <- surveys_complete %>% count(species_id) %>% filter(n >= 50) surveys_complete <- surveys_complete %>% filter(species_id %in% species_counts$species_id) write_csv(surveys_complete, path = "data/processed/surveys_mod_dplyr.csv") ``` ``` ## Warning: The `path` argument of `write_csv()` is deprecated as of readr 1.4.0. ## Please use the `file` argument instead. ``` <!-- dim(surveys_complete) # 304463, 13 --> --- ## tidy data as a philosohpy + datasets should be organized as __observations in rows__ and __variables in columns__ -> "tidy data" <!-- --> -- + what is an observation? wht is the sampling unit? -- + do you have information in your column names? ex. if you have two columns: `1999` and `2000`, they should be inside a variable called __year__. --- ## some examples ```r library(tidyr) table1 table2 table3 table4a #cases table4b #population ``` --- ## `pivot_longer()` and `pivot_wider()` ```r library(tidyr) table4a table4a %>% pivot_longer(cols = c(`1999`, `2000`), names_to = "year", values_to = "cases") table4b %>% pivot_longer(c(`1999`, `2000`), names_to = "year", values_to = "population") ``` --- ## `pivot_wider()` ```r table2 %>% pivot_wider(names_from = type, values_from = count) ``` --- ## other options for tidying data ```r table3 table3 %>% separate(rate, into = c("cases", "population")) table3 %>% separate(rate, into = c("cases", "population"), convert = TRUE) table5 %>% unite(new, century, year) ``` --- ## working with several tables: merges and joins + in real analysis settings you will have many tables that are related -- + relational datasets/databases -- .pull-left[ + in ecology for example: - sites x species - sites x environmental conditions - species x characteristics - individuals x individual measurement ] .pull-right[ <img src="./figs/4thcorner.jpg" width="300" /> ] --- ## working with several tables + keep the data as simple as possible, even if that means having different tables -- + for each data table have in mind the __sampling unit__. is it the species, is it the plot? is it the individual, the city? -- + have a __unique identifier for each observation__ so you can merge the data --- ## working with several tables <!-- --><!-- --> .footnote[gadenbuie/tidyexplain] --- ## working with several tables <!-- --><!-- --> .footnote[gadenbuie/tidyexplain] --- ## a short example ```r tidy4a <- table4a %>% pivot_longer(c(`1999`, `2000`), names_to = "year", values_to = "cases") tidy4b <- table4b %>% pivot_longer(c(`1999`, `2000`), names_to = "year", values_to = "population") left_join(tidy4a, tidy4b) ``` ``` ## Joining, by = c("country", "year") ``` ``` ## # A tibble: 6 x 4 ## country year cases population ## <chr> <chr> <int> <int> ## 1 Afghanistan 1999 745 19987071 ## 2 Afghanistan 2000 2666 20595360 ## 3 Brazil 1999 37737 172006362 ## 4 Brazil 2000 80488 174504898 ## 5 China 1999 212258 1272915272 ## 6 China 2000 213766 1280428583 ``` --- ## our survey data was created like that ```r download.file("https://ndownloader.figshare.com/files/3299483", "./data/raw/species.csv") download.file("https://ndownloader.figshare.com/files/10717177", "./data/raw/surveys.csv") download.file("https://ndownloader.figshare.com/files/3299474", "./data/raw/plots.csv") ``` --- ## our survey data was created like that ```r library(readr) library(dplyr) species <- read_csv("./data/raw/species.csv") head(species) surveys <- read_csv("./data/raw/surveys.csv") head(surveys) plots <- read_csv("./data/raw/plots.csv") head(plots) left_join(surveys, species) %>% left_join(plots) %>% dim() ``` --- class: middle, center ## data visualization with __ggplot2__ --- ## __ggplot2__ + __ggplot2__ separates the data from the aesthetics part and allows layers of information to be added sequentially with `+` ```r ggplot(data = <data>, mapping = aes(<mappings>)) + geom_xxx() ``` + __data__ + __mappings__: the specific variables (x, y, z, group...) + __geom_xxx()__: functions for plotting options `geom_point()`, `geom_line()` [cheat sheet link](https://rstudio.com/wp-content/uploads/2015/03/ggplot2-cheatsheet.pdf) --- ## ggplot2 plots are built sequentially in layers ```r library(ggplot2) library(readr) surveys_complete <- read_csv("data/processed/surveys_mod_dplyr.csv") ``` --- ## ggplot2 plots are built sequentially in layers <small> ```r ggplot(data = surveys_complete, # data mapping = aes(x = weight, y = hindfoot_length)) + # aesthetics geom_point() # plot function ``` <img src="04_Manipulating_files/figure-html/unnamed-chunk-14-1.png" width="350" /> --- ## you can assign a plot to an object and build on it <small> ```r weight_hind <- ggplot(data = surveys_complete, mapping = aes(x = weight, y = hindfoot_length)) weight_hind + geom_point() ``` <img src="04_Manipulating_files/figure-html/unnamed-chunk-15-1.png" width="350" /> --- ## ggplot2 plots are built sequentially in layers <small> ```r weight_hind + geom_point(alpha = 0.1) #transparency ``` <img src="04_Manipulating_files/figure-html/unnamed-chunk-16-1.png" width="350" /> --- ## ggplot2 plots are built sequentially in layers <small> ```r weight_hind + geom_point(alpha = 0.1, color = "blue") #color ``` <img src="04_Manipulating_files/figure-html/unnamed-chunk-17-1.png" width="350" /> --- ## ggplot2 plots are built sequentially in layers <small> ```r weight_hind + geom_point(alpha = 0.1, aes(color = "blue")) #this is a mistake! ``` <img src="04_Manipulating_files/figure-html/unnamed-chunk-18-1.png" width="350" /> ```r #blue is not a variable so it should not go inside aes() ``` --- ## ggplot2 plots are built sequentially in layers <small> ```r weight_hind + geom_point(alpha = 0.1, aes(color = species_id)) ``` <img src="04_Manipulating_files/figure-html/unnamed-chunk-19-1.png" width="350" /> ```r # but variables do go inside aes() ``` --- ## challenge: change x to categorial variable <small> ```r ggplot(data = surveys_complete, mapping = aes(x = species_id, y = weight)) + geom_point(aes(color = plot_type)) ``` <img src="04_Manipulating_files/figure-html/unnamed-chunk-20-1.png" width="350" /> --- ## boxplots! <small> ```r # boxplots ggplot(data = surveys_complete, mapping = aes(x = species_id, y = weight)) + geom_boxplot() ``` <img src="04_Manipulating_files/figure-html/unnamed-chunk-21-1.png" width="350" /> --- ## theme options `theme_` <small> ```r ggplot(data = surveys_complete, mapping = aes(x = species_id, y = weight)) + geom_boxplot() + theme_classic() ``` <img src="04_Manipulating_files/figure-html/unnamed-chunk-22-1.png" width="350" /> --- ## add jitter layer <small> ```r ggplot(data = surveys_complete, mapping = aes(x = species_id, y = weight)) + geom_boxplot() + geom_jitter(alpha = 0.3, color = "dodgerblue", width = 0.2) + theme_classic() ``` <img src="04_Manipulating_files/figure-html/unnamed-chunk-23-1.png" width="350" /> --- ## change plot order <small> ```r ggplot(data = surveys_complete, mapping = aes(x = species_id, y = weight)) + geom_jitter(alpha = 0.3, color = "dodgerblue", width = 0.2) + geom_boxplot() + theme_classic() ``` <img src="04_Manipulating_files/figure-html/unnamed-chunk-24-1.png" width="350" /> --- ## violin plots <small> ```r ggplot(data = surveys_complete, mapping = aes(x = species_id, y = weight)) + geom_violin() + theme_classic() ``` <img src="04_Manipulating_files/figure-html/unnamed-chunk-25-1.png" width="350" /> --- ## change scale (`scale_xx` options) <small> ```r p <- ggplot(data = surveys_complete, mapping = aes(x = species_id, y = weight)) + geom_violin() + scale_y_log10() + theme_classic() #nice! p ``` <img src="04_Manipulating_files/figure-html/unnamed-chunk-26-1.png" width="350" /> --- ## add title `ggtitle()` ```r p + #remember the plot can be an object ggtitle("Nice violin plot") ``` <img src="04_Manipulating_files/figure-html/unnamed-chunk-27-1.png" width="350" /> --- ## ggplot2 plots are built sequentially in layers <small> ```r ggplot(data = surveys_complete, mapping = aes(x = species_id, y = hindfoot_length)) + geom_jitter(size = 0.5, alpha = 0.1, width = 0.2, aes(col = plot_id)) + geom_boxplot() + scale_y_log10() + theme_classic() + ggtitle("Nice violin plot") ``` <img src="04_Manipulating_files/figure-html/unnamed-chunk-28-1.png" width="350" /> --- ## what would be next? - learn to write __functions__ for your own workflow and other programming tools to __iterate__ these functions accross many inputs (loops and the __purrr__ package) - study R-specific literature such as R4DS and Advanced R - study specific packages in your area, read their vignettes and documentation, get acquainted with the workflows - learn tools for __communicating__ your results (text, presentations, dashboards): markdown & R markdown, __xaringan__ (presentations) - learn about version control (__git__) to backup and control changes for your projects --- # references + R for data science + Reproducible workflows + [https://github.com/gadenbuie/tidyexplain](https://github.com/gadenbuie/tidyexplain) --- class: center, middle # ¡Thanks! <center> <svg viewBox="0 0 512 512" style="position:relative;display:inline-block;top:.1em;fill:#A70000;height:1em;" xmlns="http://www.w3.org/2000/svg"> <path d="M476 3.2L12.5 270.6c-18.1 10.4-15.8 35.6 2.2 43.2L121 358.4l287.3-253.2c5.5-4.9 13.3 2.6 8.6 8.3L176 407v80.5c0 23.6 28.5 32.9 42.5 15.8L282 426l124.6 52.2c14.2 6 30.4-2.9 33-18.2l72-432C515 7.8 493.3-6.8 476 3.2z"></path></svg> [andreasancheztapia@gmail.com](mailto:andreasancheztapia@gmail.com) <svg viewBox="0 0 512 512" style="position:relative;display:inline-block;top:.1em;fill:#A70000;height:1em;" xmlns="http://www.w3.org/2000/svg"> <path d="M459.37 151.716c.325 4.548.325 9.097.325 13.645 0 138.72-105.583 298.558-298.558 298.558-59.452 0-114.68-17.219-161.137-47.106 8.447.974 16.568 1.299 25.34 1.299 49.055 0 94.213-16.568 130.274-44.832-46.132-.975-84.792-31.188-98.112-72.772 6.498.974 12.995 1.624 19.818 1.624 9.421 0 18.843-1.3 27.614-3.573-48.081-9.747-84.143-51.98-84.143-102.985v-1.299c13.969 7.797 30.214 12.67 47.431 13.319-28.264-18.843-46.781-51.005-46.781-87.391 0-19.492 5.197-37.36 14.294-52.954 51.655 63.675 129.3 105.258 216.365 109.807-1.624-7.797-2.599-15.918-2.599-24.04 0-57.828 46.782-104.934 104.934-104.934 30.213 0 57.502 12.67 76.67 33.137 23.715-4.548 46.456-13.32 66.599-25.34-7.798 24.366-24.366 44.833-46.132 57.827 21.117-2.273 41.584-8.122 60.426-16.243-14.292 20.791-32.161 39.308-52.628 54.253z"></path></svg> [@SanchezTapiaA](https://twitter.com/SanchezTapiaA) <svg viewBox="0 0 496 512" style="position:relative;display:inline-block;top:.1em;fill:#A70000;height:1em;" xmlns="http://www.w3.org/2000/svg"> <path d="M165.9 397.4c0 2-2.3 3.6-5.2 3.6-3.3.3-5.6-1.3-5.6-3.6 0-2 2.3-3.6 5.2-3.6 3-.3 5.6 1.3 5.6 3.6zm-31.1-4.5c-.7 2 1.3 4.3 4.3 4.9 2.6 1 5.6 0 6.2-2s-1.3-4.3-4.3-5.2c-2.6-.7-5.5.3-6.2 2.3zm44.2-1.7c-2.9.7-4.9 2.6-4.6 4.9.3 2 2.9 3.3 5.9 2.6 2.9-.7 4.9-2.6 4.6-4.6-.3-1.9-3-3.2-5.9-2.9zM244.8 8C106.1 8 0 113.3 0 252c0 110.9 69.8 205.8 169.5 239.2 12.8 2.3 17.3-5.6 17.3-12.1 0-6.2-.3-40.4-.3-61.4 0 0-70 15-84.7-29.8 0 0-11.4-29.1-27.8-36.6 0 0-22.9-15.7 1.6-15.4 0 0 24.9 2 38.6 25.8 21.9 38.6 58.6 27.5 72.9 20.9 2.3-16 8.8-27.1 16-33.7-55.9-6.2-112.3-14.3-112.3-110.5 0-27.5 7.6-41.3 23.6-58.9-2.6-6.5-11.1-33.3 2.6-67.9 20.9-6.5 69 27 69 27 20-5.6 41.5-8.5 62.8-8.5s42.8 2.9 62.8 8.5c0 0 48.1-33.6 69-27 13.7 34.7 5.2 61.4 2.6 67.9 16 17.7 25.8 31.5 25.8 58.9 0 96.5-58.9 104.2-114.8 110.5 9.2 7.9 17 22.9 17 46.4 0 33.7-.3 75.4-.3 83.6 0 6.5 4.6 14.4 17.3 12.1C428.2 457.8 496 362.9 496 252 496 113.3 383.5 8 244.8 8zM97.2 352.9c-1.3 1-1 3.3.7 5.2 1.6 1.6 3.9 2.3 5.2 1 1.3-1 1-3.3-.7-5.2-1.6-1.6-3.9-2.3-5.2-1zm-10.8-8.1c-.7 1.3.3 2.9 2.3 3.9 1.6 1 3.6.7 4.3-.7.7-1.3-.3-2.9-2.3-3.9-2-.6-3.6-.3-4.3.7zm32.4 35.6c-1.6 1.3-1 4.3 1.3 6.2 2.3 2.3 5.2 2.6 6.5 1 1.3-1.3.7-4.3-1.3-6.2-2.2-2.3-5.2-2.6-6.5-1zm-11.4-14.7c-1.6 1-1.6 3.6 0 5.9 1.6 2.3 4.3 3.3 5.6 2.3 1.6-1.3 1.6-3.9 0-6.2-1.4-2.3-4-3.3-5.6-2z"></path></svg><svg viewBox="0 0 512 512" style="position:relative;display:inline-block;top:.1em;fill:#A70000;height:1em;" xmlns="http://www.w3.org/2000/svg"> <path d="M105.2 24.9c-3.1-8.9-15.7-8.9-18.9 0L29.8 199.7h132c-.1 0-56.6-174.8-56.6-174.8zM.9 287.7c-2.6 8 .3 16.9 7.1 22l247.9 184-226.2-294zm160.8-88l94.3 294 94.3-294zm349.4 88l-28.8-88-226.3 294 247.9-184c6.9-5.1 9.7-14 7.2-22zM425.7 24.9c-3.1-8.9-15.7-8.9-18.9 0l-56.6 174.8h132z"></path></svg> <svg viewBox="0 0 512 512" style="position:relative;display:inline-block;top:.1em;fill:#A70000;height:1em;" xmlns="http://www.w3.org/2000/svg"> <path d="M22.2 32A16 16 0 0 0 6 47.8a26.35 26.35 0 0 0 .2 2.8l67.9 412.1a21.77 21.77 0 0 0 21.3 18.2h325.7a16 16 0 0 0 16-13.4L505 50.7a16 16 0 0 0-13.2-18.3 24.58 24.58 0 0 0-2.8-.2L22.2 32zm285.9 297.8h-104l-28.1-147h157.3l-25.2 147z"></path></svg> [andreasancheztapia](http://github.com/andreasancheztapia)